
This is the second of a two part series in which we focus on interesting queries and visualizations using the data pipeline we created in part one.
In part one, we covered the problem statement and the data engineering solution, including all the code needed to build a reliable, robust big data processing pipeline. In this part two, we’ll cover some of the fun things we can do once we have our data pipeline running: interesting queries and data visualizations and a Data Studio dashboard you can try yourself.
What can we do with this data?
For starters, let’s find out the most popular Wikipedia article so far this year:
Click here to expand code
|
|
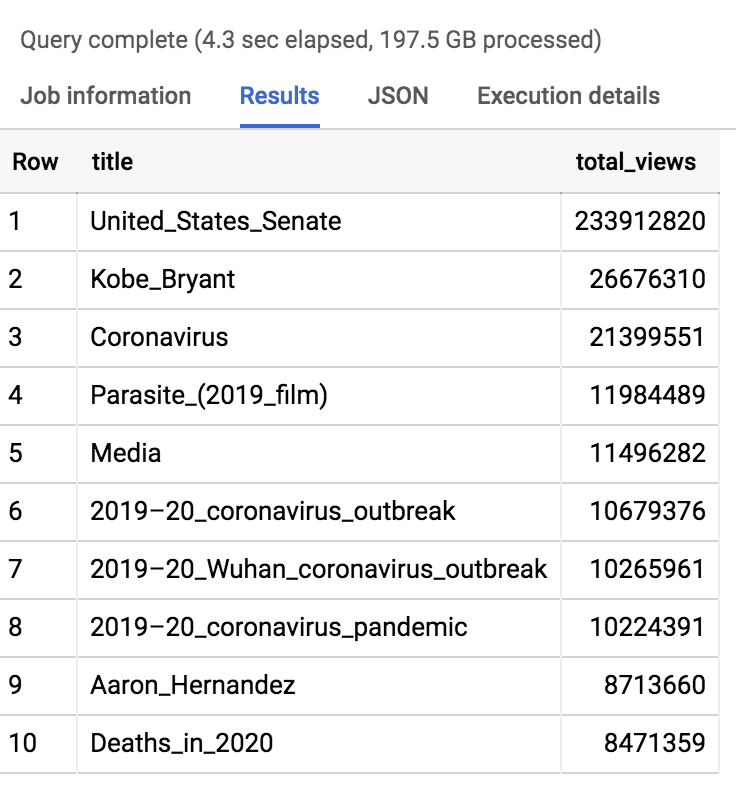
It’s only rock & roll, but I like it
That last query was interesting but it doesn’t take advantage of the entity data we worked so hard to process in part 1. Let’s construct an example leveraging our wikidata table to find the most viewed pages for rock bands in 2020. Of course, this begs the question, what is a rock band? Wikidata to the rescue!
You can search the wikidata interactively via the wikidata site, like this:
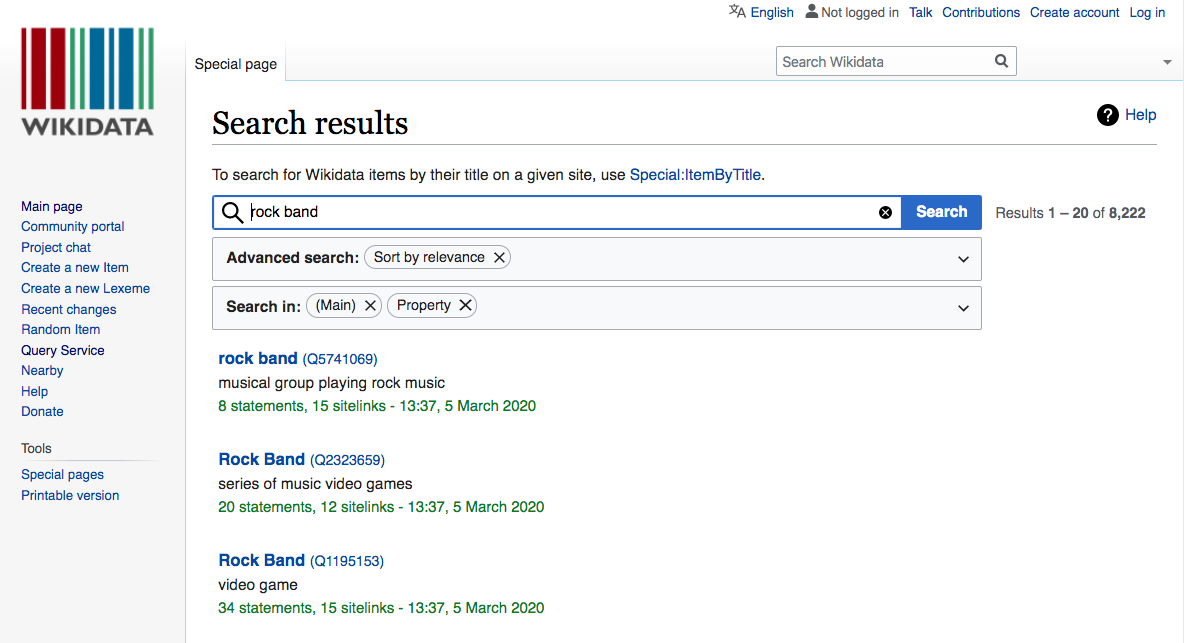
This shows us that “rock band” matches multiple entities, including the video game of the same name. The entity we’re after is the first one: 5741069. One way to confirm this finding is to search for a known entity that should be in this category:
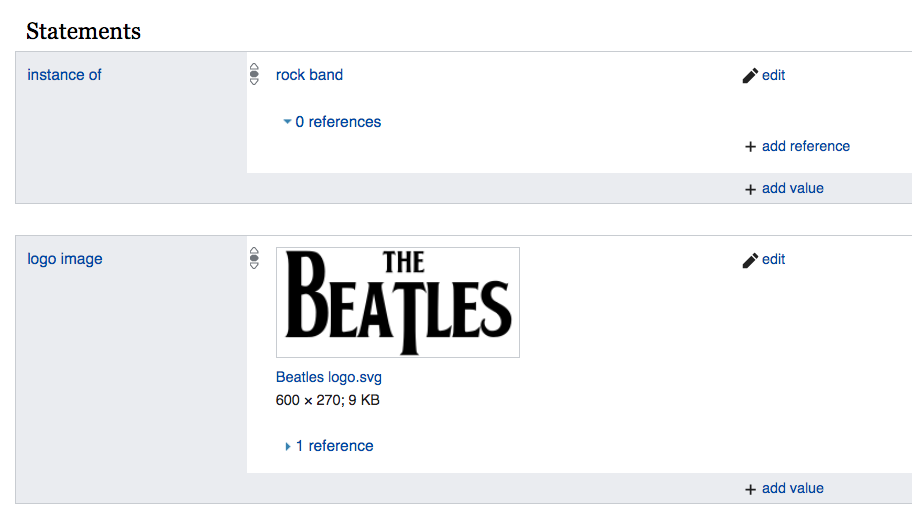
Here we see that the preeminent rock band, The Beatles, is indeed classified as an instance of “Rock Band”. But this doesn’t catch every page I’m interested. For example, Radiohead is considered an instance of “Musical Group” (215380).
Armed with those two entity ids, we can now do some queries about popular bands. But I want to do one more thing before we start querying. Since our scope is limited to just those two entities, it’s wasteful to search the full 10TB dataset on every query. Wouldn’t it be nice if there was a way to limit our search to include only the pages we care about? Well, there is - we’ll create what BigQuery calls a view, which will limit our query scope to only the view counts for pages about bands.
Here’s the SQL code to create my view, which I’ve made public so you can try it too:
Click here to expand code
|
|
This view gives us a dataset we can query much more quickly and economically, because we’re only scanning information associated with bands, which is a small subset of the overall dataset.
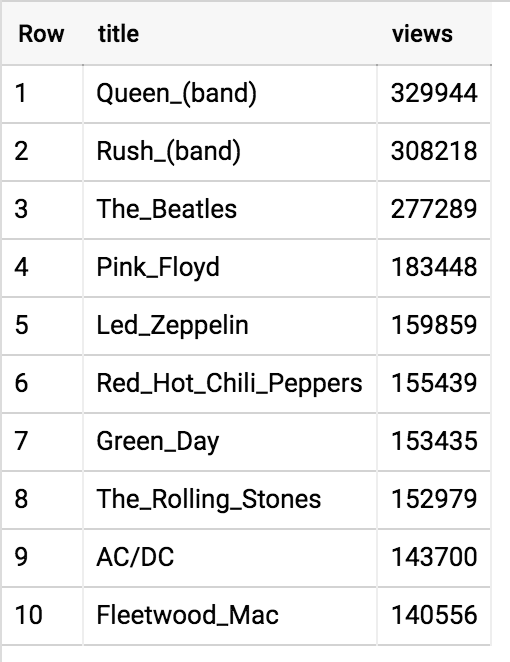
Let’s find the most wiki-popular band so far in 2020 with this query:
Click here to expand code
|
|
And the results as of this writing…
Let’s make a dashboard!
This is fun but:
- It’s a snapshot of a single moment – it doesn’t give us any sense of how this data varies over time.
- SQL queries can be a bit complicated, especially for beginners.
- This query is interactive for me but I’d like to somehow share that interactivity with others.
Wouldn’t it be nice if I could easily, without writing a single line of code, allow everyone to query this data, with mouse clicks rather than SQL queries, and to see the results in a nice color coded time series graph?
Using Google Data Studio, I made just such a dashboard, which I’ve embeded below. Give it a try – you can play with the selected bands and the time frame you’d like to analyse.
For example, I wonder which band, during the last five years, was more popular: the Beatles or the Stones? We can use this dashboard to find out in just a few seconds:
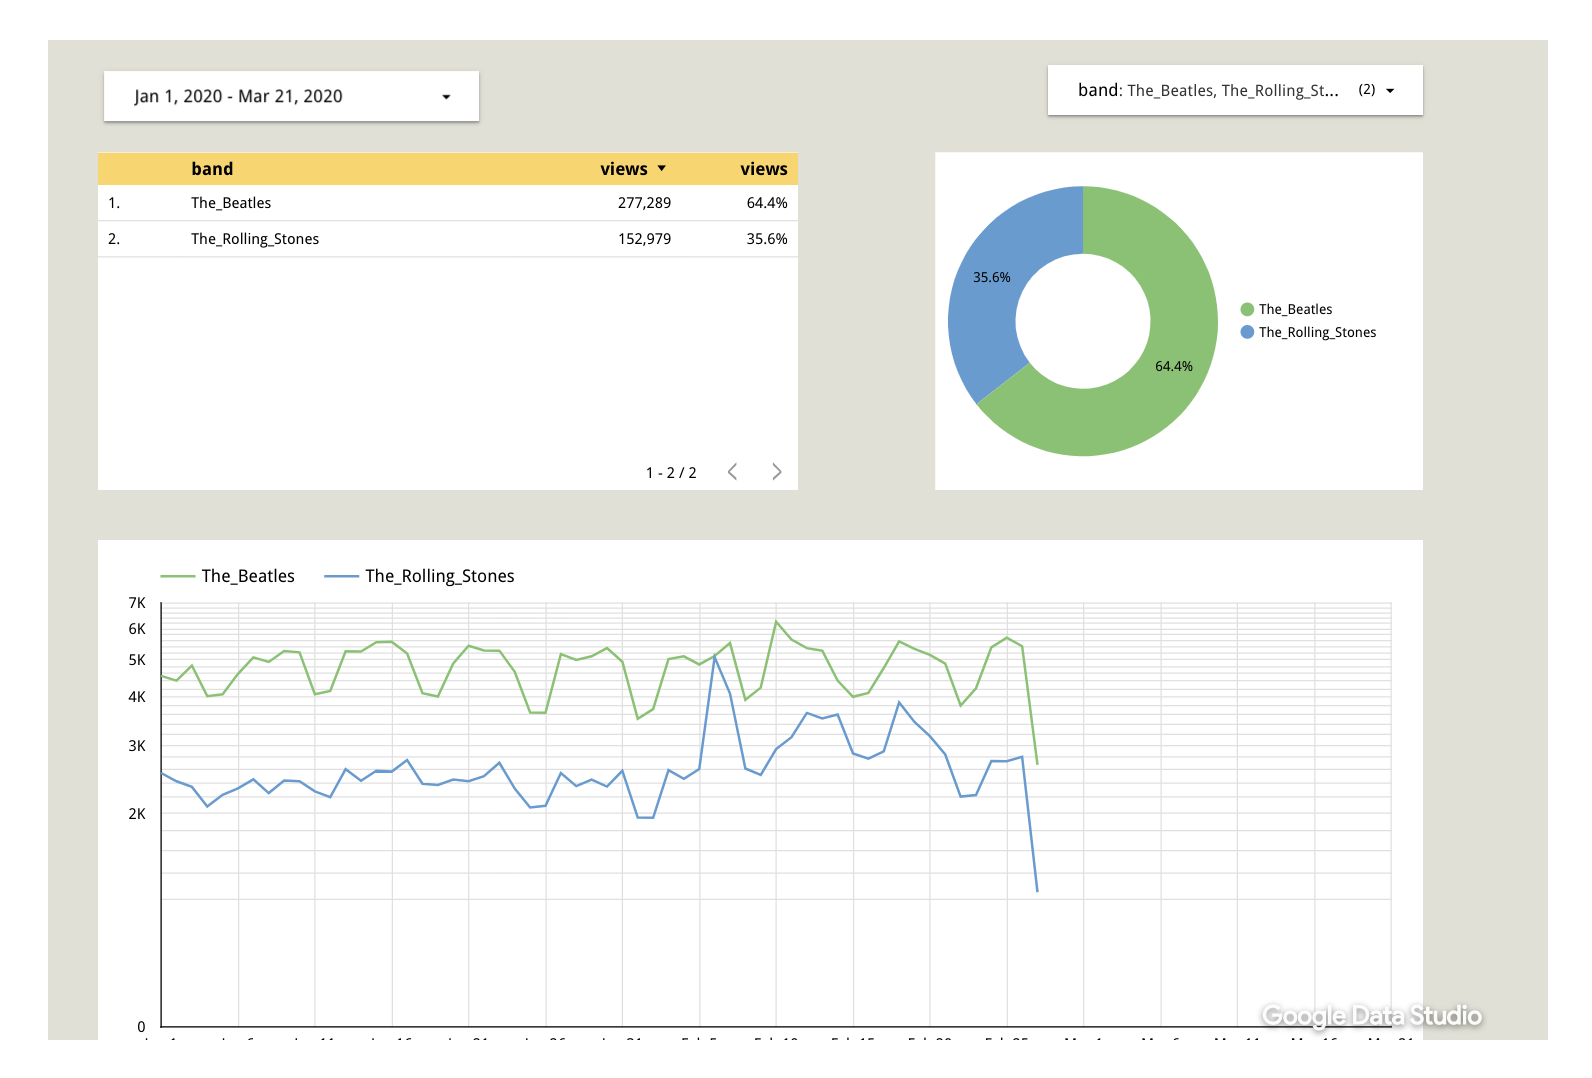
Despite having ended their career fifty years ago, the Beatles continue to gather a pretty impressive level of attention in Wikipedia page views.
Now it’s your turn
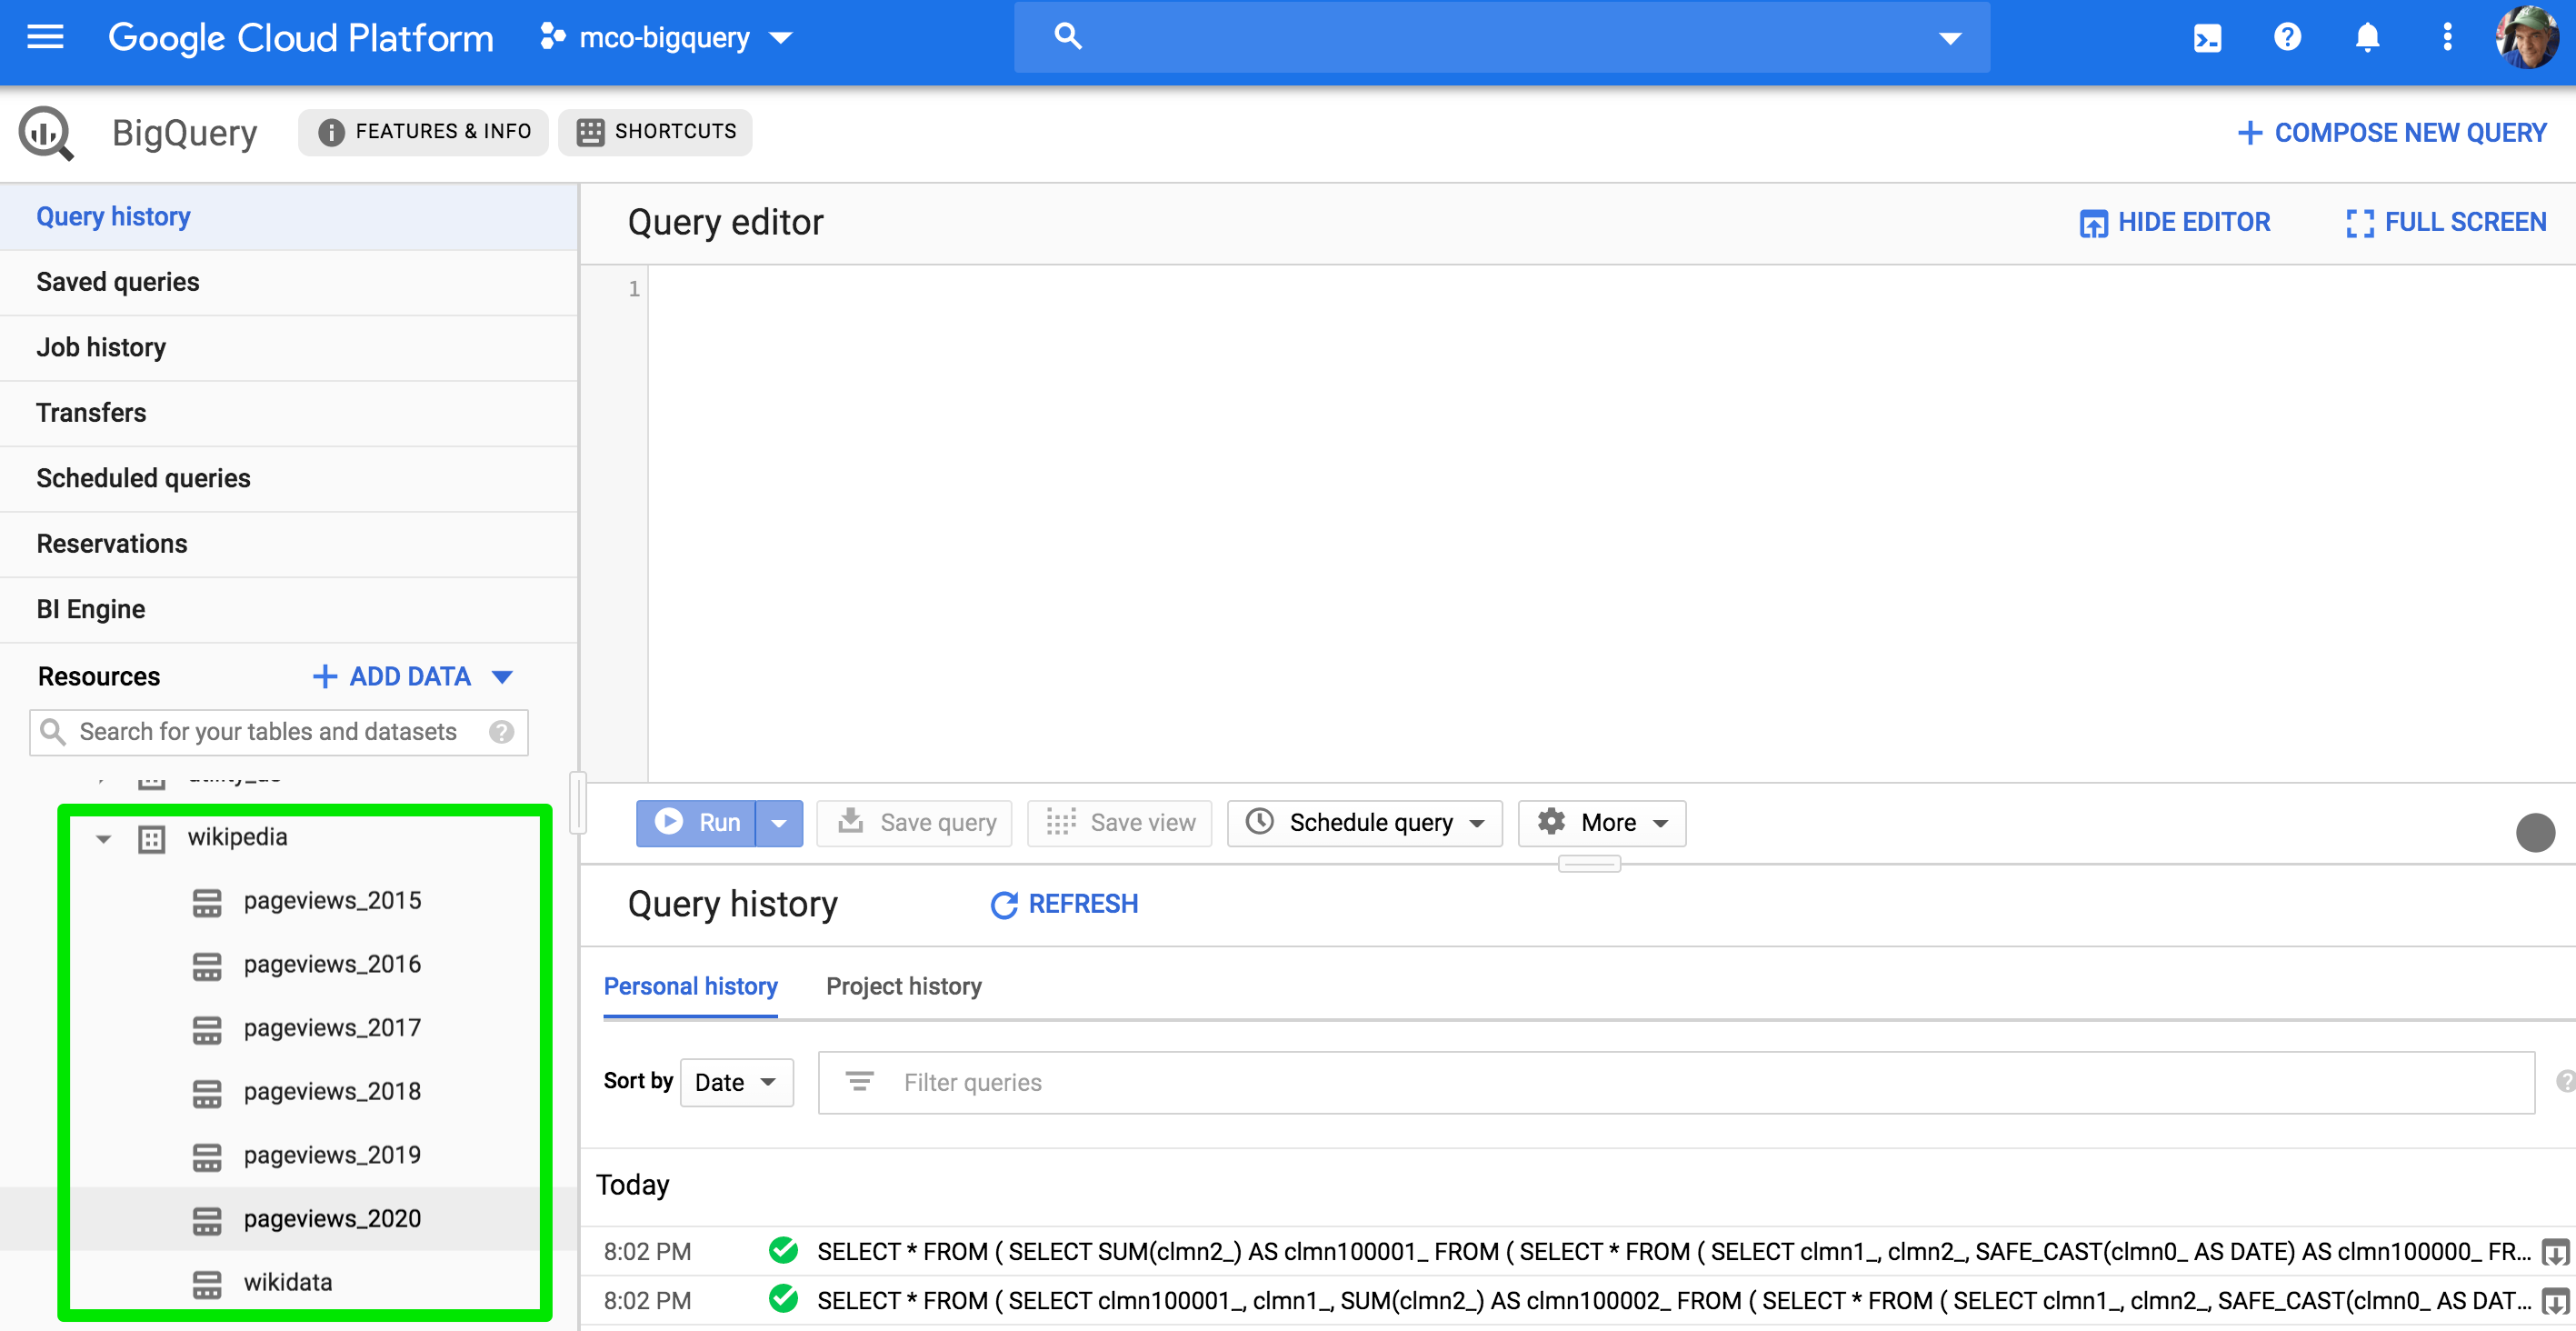
I’ve made this data available to everyone in the BigQuery Public Dataset collection. The pageviews are coming in roughly every hour and the entity data gets refreshed every 3-4 days. The data can be found in the bigquery-public-data collection, under Wikipedia, as shown below:
These tables are partitioned so you can save time and cost by time limiting your queries, like this:
Click here to expand code
|
|
The “Battle of the Bands” dashboard is also available for your use at mco.fyi/bands.
Resources and Acknowledgements
- Part 1 of this series
- All of the code described in this article can be found here: github.com/marcacohen/wikidata.
- Many thanks to Felipe Hoffa. Several of the queries and data management techniques in this article were derived from Felipe’s excellent articles on partitioning and lazy loading, and clustering.
- Shane Glass provided invaluable support helping me add this data to the wonderful Google Cloud Public Datasets collection.